Welcome to the tutorial about SAP Statistical Key Figures. This tutorial is part of our free SAP CO training. SAP statistical key figures are used as the tracing factors or basis for assessments in SAP Management Accounting (SAP CO). They are purely statistical information such as, for example, an area in square meters, number of employees, etc. SAP statistical key figures are used in a situation where it is not possible to use any other standard method or measurement to derive the share of costs for allocation of costs in cost centers.
SAP statistical key figures are statistically measurable values which can be applied to cost centers, profit centers, internal orders or business processes. SAP statistical key figures are also used for analysis purposes like calculation of rent cost per each employee of a company.
So, just to add to the definition you could say that statistical key figures represent statistics in internal orders, cost centers and profit centers which are measured in quantity or time units and which are used for allocation of costs.
SAP statistical key figure is basically a number which provides non-monetary data related to organizational units. Such as:
- Number of machines
- Number of employees
- Capacity usage
- Calling units for telephones
- Number of PC’s
The usage of statistical key figures is to provide additional characteristic information related to the cost center or any other organizational unit besides monetary information. Statistical key figures can be used in allocation as well as for reporting purposes.
Reporting:
- Sales per employee
- Personnel cost per sales area
Allocation:
- Distribution of fixed capital such as buildings to profit centers as per the number of square meters
Let’s consider an example. Assume that 10,000 USD is incurred by an organization on the cost center of cafeteria, the cost of which has to be allocated or distributed to other cost centers for internal analysis. This can be achieved with the help of SAP statistical key figures. Number of employees can be used as statistical key figure and the cost can be distributed between other cost centers such the administration office (100 employees) and the plant (250 employees).
Statistical key figures are flexible to use two categories namely fixed value and total value. Fixed values are used where the values do not change very often like number of employees, area, etc. Whereas total value is used when the value is expected to change or not constant for a very long time such electricity or water usage.
In addition, you can also link the data from Logistic Information System (LIS) in SAP to Management Accounting module with the help of statistical key figures but is not strictly necessary.
You can also create statistical key figure groups where grouping of similar key figures in one group is possible and used for selection of data reports in the information system.
How to Create SAP Statistical Key Figures (SKF)
If you want to create a new statistical key figure, you should either lunch the transaction KK01 from the transaction bar or navigate to the following path in SAP Easy Access Menu:
SAP Menu – Accounting – Controlling – Cost Center Accounting – Master Data – Statistical Key Figures – Individual processing – KK01 Create
Please note that you can create key figures from the SAP Menu of activity-based costing and profit center accounting as well.
The table where SAP stores Statistical Key Figures is TKA03.
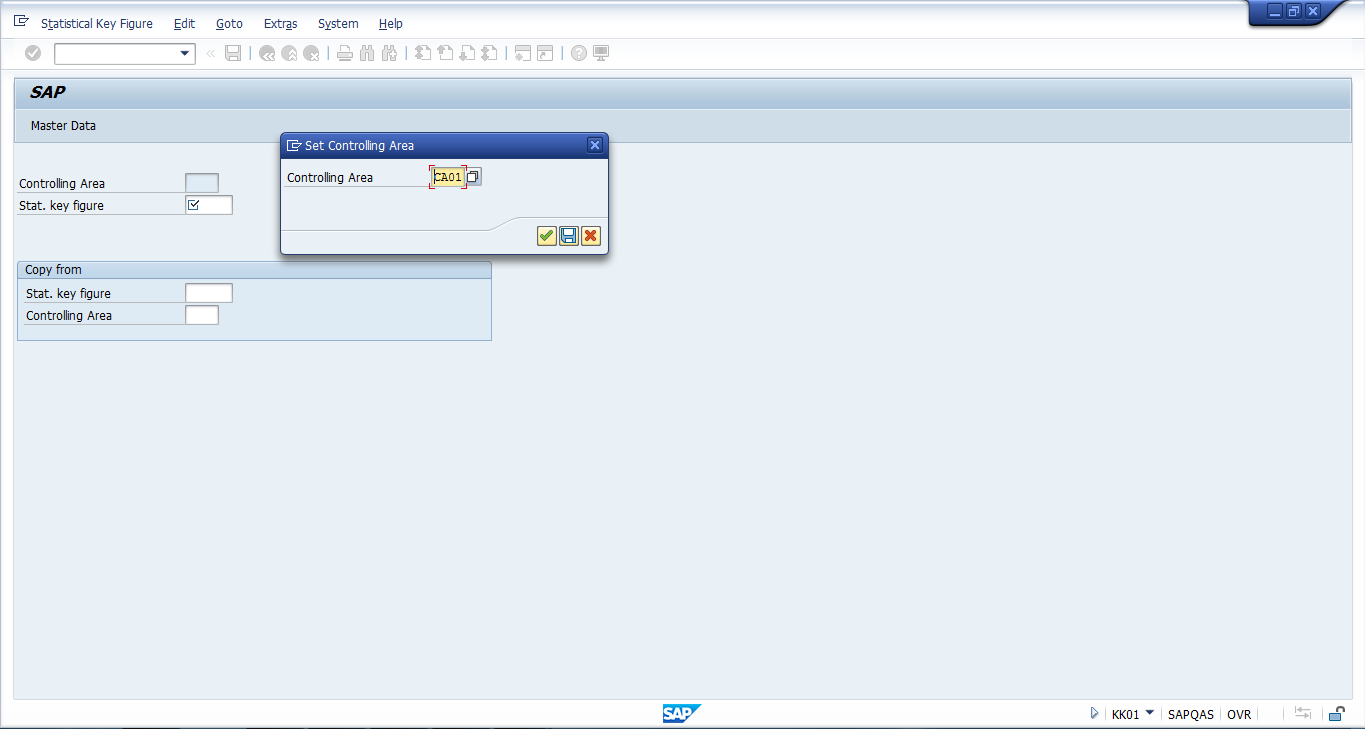
On the initial screen of KK01 transaction, the system will ask you to specify a controlling area. Enter the controlling area and press OK ![]() button.
button.
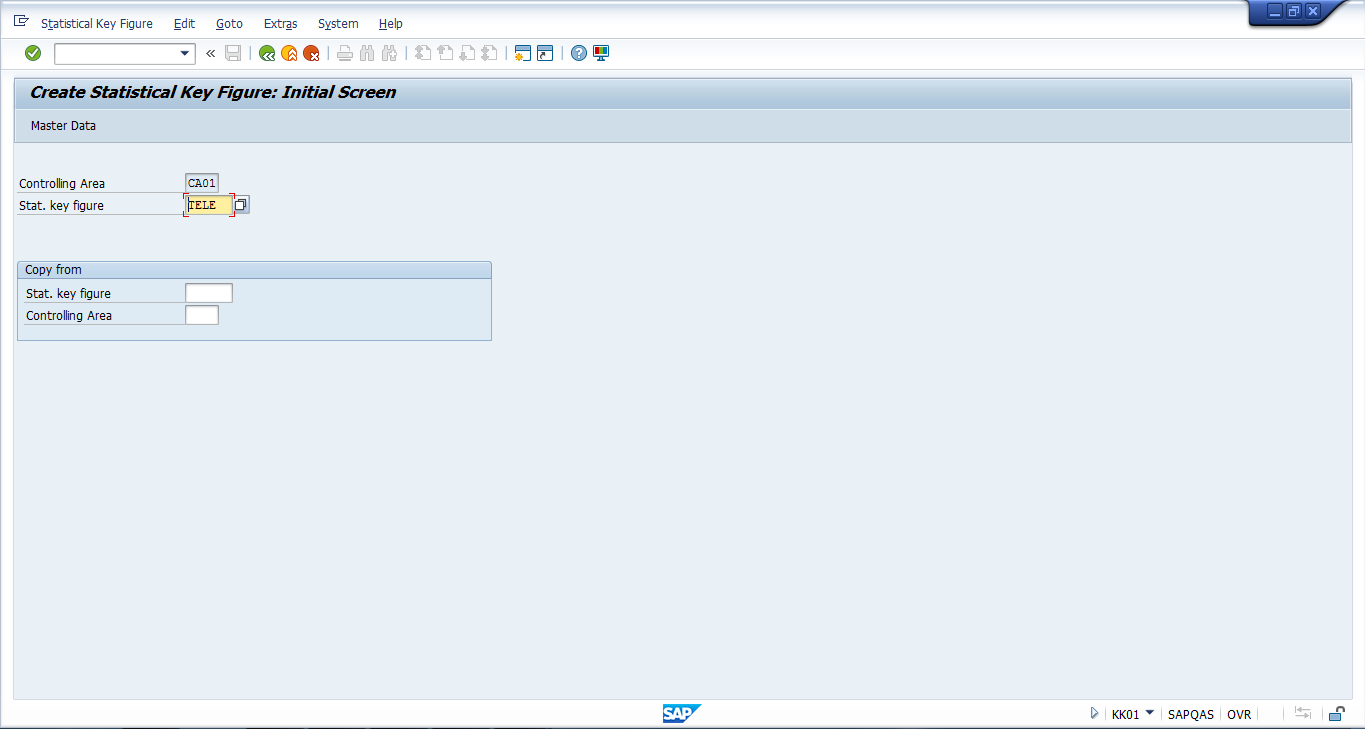
Next, enter the code of the new key figures that you would like to create in Stat. key figure field and click on Master Data button.
The system will show the next screen of this transaction where it is necessary to enter the following details under Basic data tab:
- Name of the new statistical key figure
- Unit of measurement
- Key figure category (fixed or total values)
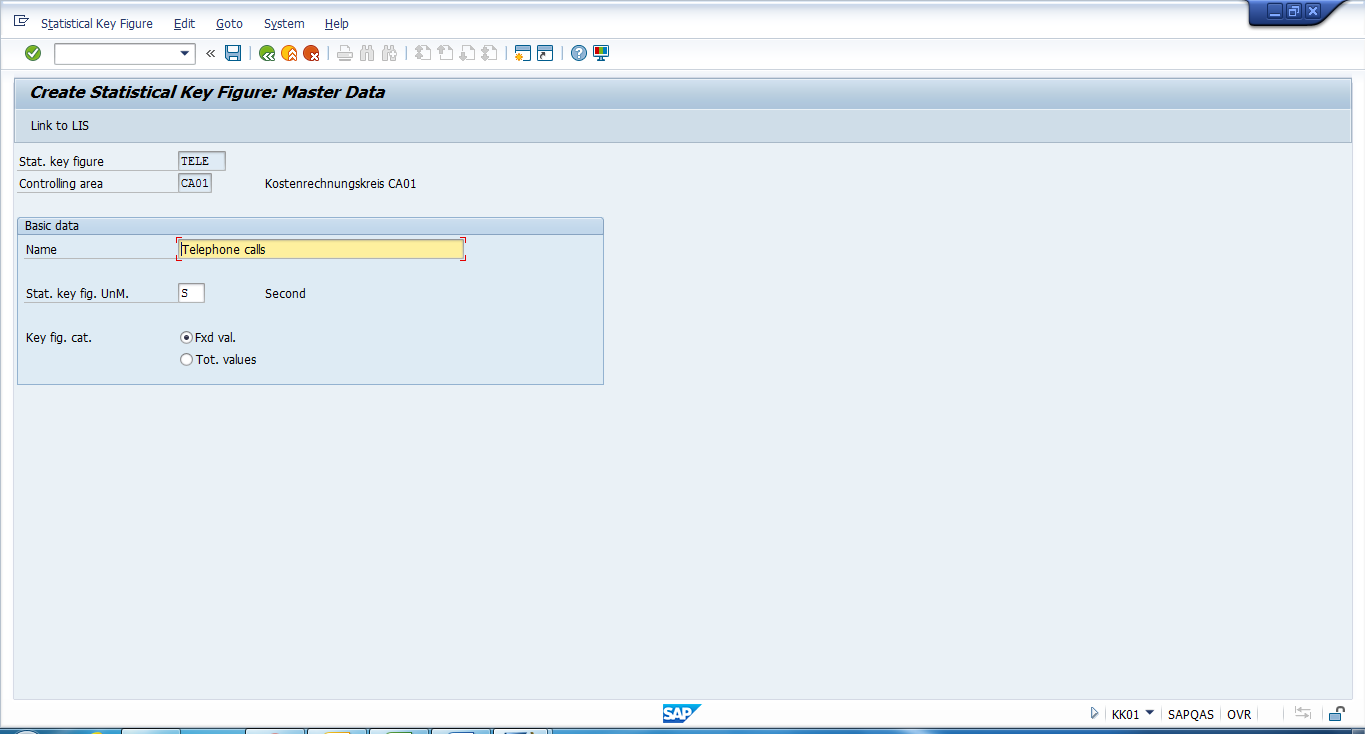
As soon as you are done with entering these details, click on save ![]() button. Then, the SAP system will create the new key figure.
button. Then, the SAP system will create the new key figure.
How to Create Statistical Key Figure Group
If you want to create a new statistical key figure group, you should either lunch the transaction KBH1 from the transaction bar or navigate to the following path in SAP Easy Access Menu:
SAP Menu – Accounting – Controlling – Cost Center Accounting – Master Data – Statistical Key Figure Group – KBH1 Create
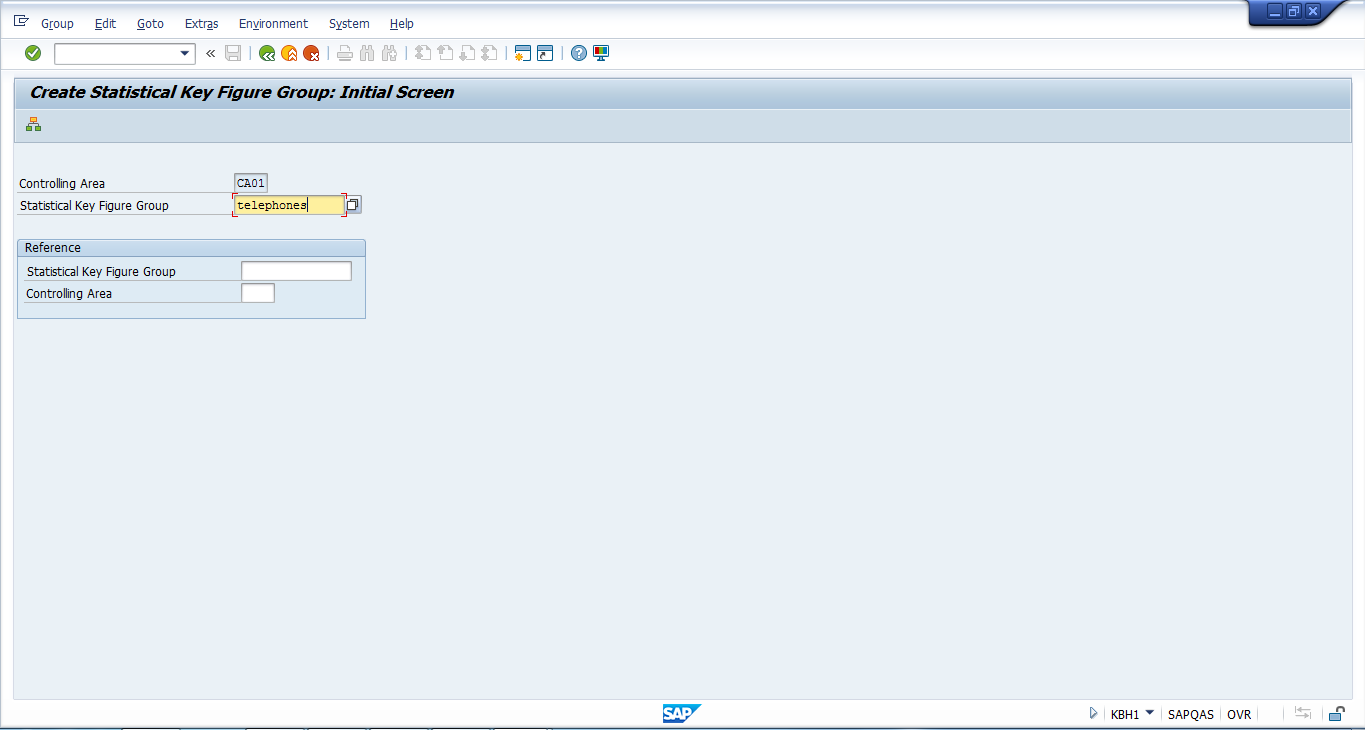
On the initial screen of KBH1 transaction, the system will ask you to specify a controlling area. Enter the controlling area and press OK ![]() button. Next, enter the group name which you want to create and press Enter button.
button. Next, enter the group name which you want to create and press Enter button.
The system will show the next screen of the transaction where you should enter the key figures which you want to have under this group.
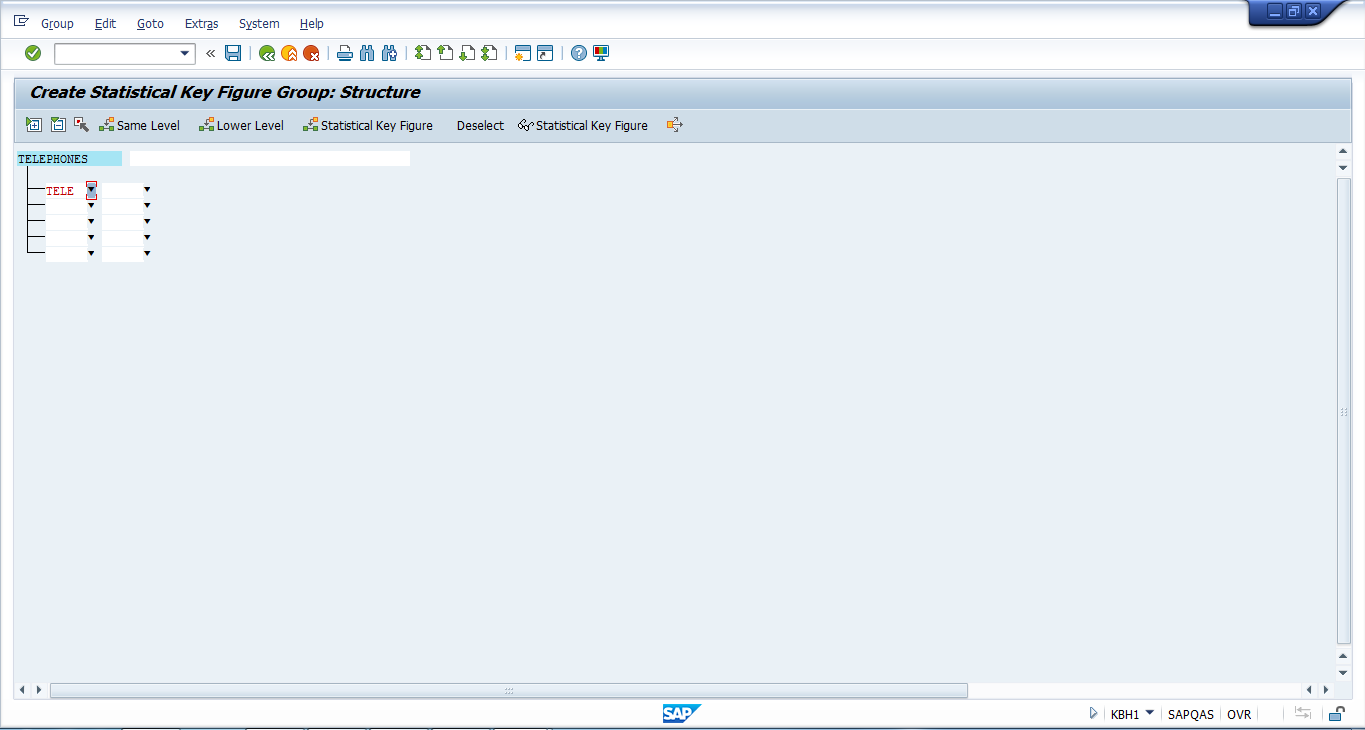
As soon as the structure is defined, save it using ![]() button and your new statistical key figure group will be created.
button and your new statistical key figure group will be created.
Leave A Comment?
You must be logged in to post a comment.